Statistics
Graphing
If you need to graph your mail server performance in real time you might try to use one of the graphing scripts. All of them use RRDtool to create real time graphs.
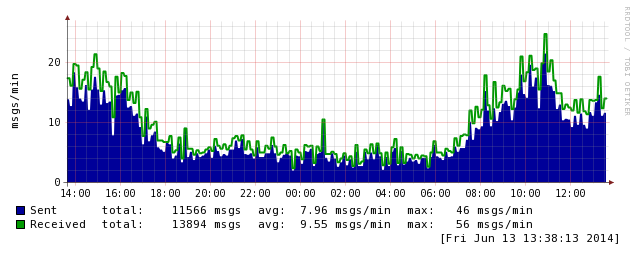
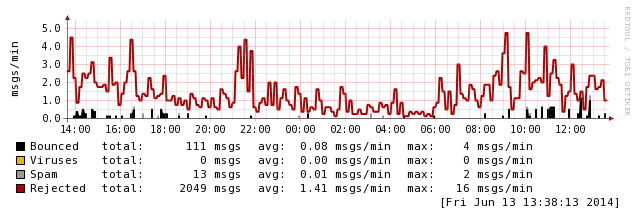
Mailgraph
Uses RRDtool to graph mail traffic (Sent/Received, Bounced/Viruses/Spam/Rejected) daily, weekly, monthly, yearly.
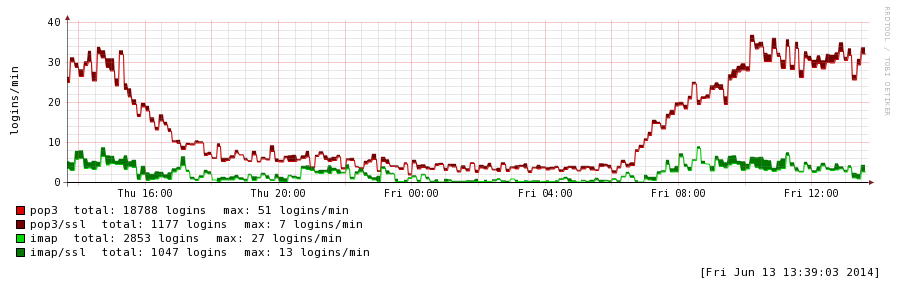
Couriergraph
Uses RRDtool to graph POP3/IMAP server traffic (Sent/Received, Bounced/Viruses/Spam/Rejected) daily, weekly, monthly, yearly.
Mail Log Analyzers